
Observability with Cluster Observability Operator
This section describes how to configure observability for the NFL-Wallet gateway so you can view Total Requests, Successful Requests, and Error Rate (and other Istio/Envoy metrics) in the OpenShift observability UI. The configuration uses the Cluster Observability Operator (RHOBS) and is managed via the Helm chart (ThanosQuerier, PodMonitor/ServiceMonitor for the gateway, and UIPlugin).
What You Need
Cluster Observability Operator
- The Cluster Observability Operator must be installed on the cluster (Red Hat OpenShift Cluster Observability Operator / RHOBS).
- The operator provides:
- MonitoringStack and related CRDs (
monitoring.rhobs). - ThanosQuerier for querying metrics.
- ServiceMonitor and PodMonitor (API
monitoring.rhobs/v1) so Prometheus scrapes targets. - UIPlugin (
observability.openshift.io/v1alpha1) to enable the Monitoring UI in the OpenShift console.
- MonitoringStack and related CRDs (
Namespace and gateway
- The namespace
openshift-cluster-observability-operatormust exist (it is typically created when the operator is installed). - The Gateway for NFL-Wallet must be deployed (e.g. via the Helm chart with
gateway.enabled=true) so gateway proxy pods exist innfl-walletand expose metrics on port 15020 (or 15090 on the Service if using ServiceMonitor).
How to Configure Observability (Helm)
Enable observability by upgrading the release with the RHOBS options. The chart renders ThanosQuerier, PodMonitor or ServiceMonitor for the gateway, and the Monitoring UIPlugin into the observability operator namespace.
Helm upgrade: enable full observability
From the repository root, run:
helm upgrade nfl-wallet ./helm/nfl-wallet -n nfl-wallet --install \
  --set gateway.enabled=true \
  --set observability.rhobs.enabled=true \
  --set observability.rhobs.thanosQuerier.enabled=true \
  --set observability.rhobs.podMonitorGateway.enabled=true \
  --set observability.rhobs.uiPlugin.enabled=true
observability.rhobs.enabled=true— Enables rendering of RHOBS resources (ThanosQuerier, gateway monitors, UIPlugin).observability.rhobs.thanosQuerier.enabled=true— Creates the ThanosQuerier (selector matches MonitoringStack withapp.kubernetes.io/part-of: nfl-walletby default).observability.rhobs.podMonitorGateway.enabled=true— Creates a PodMonitor that scrapes the gateway pods on port 15020 (recommended when the gateway Service does not expose the metrics port).observability.rhobs.uiPlugin.enabled=true— Creates the UIPlugin so the Monitoring UI appears in the OpenShift console.
Resources are created in observability.rhobs.namespace (default: openshift-cluster-observability-operator). Ensure that namespace exists and the release has permission to create resources there.
Using ServiceMonitor instead of PodMonitor
If the gateway Service exposes the metrics port (e.g. 15090), you can use ServiceMonitor instead:
helm upgrade nfl-wallet ./helm/nfl-wallet -n nfl-wallet --install \
  --set gateway.enabled=true \
  --set observability.rhobs.enabled=true \
  --set observability.rhobs.thanosQuerier.enabled=true \
  --set observability.rhobs.podMonitorGateway.enabled=false \
  --set observability.rhobs.serviceMonitorGateway.enabled=true \
  --set observability.rhobs.uiPlugin.enabled=true
Optional: custom observability namespace or part-of label
helm upgrade nfl-wallet ./helm/nfl-wallet -n nfl-wallet --install \
  --set gateway.enabled=true \
  --set observability.rhobs.enabled=true \
  --set observability.rhobs.namespace=openshift-cluster-observability-operator \
  --set observability.rhobs.thanosQuerier.partOfLabel=nfl-wallet \
  --set observability.rhobs.thanosQuerier.enabled=true \
  --set observability.rhobs.podMonitorGateway.enabled=true \
  --set observability.rhobs.uiPlugin.enabled=true
After the upgrade, the operator’s Prometheus will scrape the gateway and you can query metrics (e.g. istio_requests_total) and view Total Requests, Successful Requests, and Error Rate in the observability UI.
Resources rendered by the chart (RHOBS)
When observability.rhobs.enabled=true, the chart creates the following resources in the observability namespace:
| Resource | Helm flag | Description |
|---|---|---|
| ThanosQuerier | observability.rhobs.thanosQuerier.enabled=true |
Query component for the monitoring stack (monitoring.rhobs/v1alpha1). Selector matches MonitoringStack by part-of label. |
| PodMonitor (gateway) | observability.rhobs.podMonitorGateway.enabled=true |
Scrapes gateway pods in nfl-wallet on port 15020. |
| ServiceMonitor (gateway) | observability.rhobs.serviceMonitorGateway.enabled=true |
Scrapes gateway Service in nfl-wallet on port 15090. |
| UIPlugin | observability.rhobs.uiPlugin.enabled=true |
Enables the Monitoring UI in the OpenShift console (observability.openshift.io/v1alpha1). |
Observability and traffic analysis in the console
The following screenshots show the observability UI and traffic analysis once the Cluster Observability Operator, gateway monitors, and UIPlugin are configured.
Observability dashboard
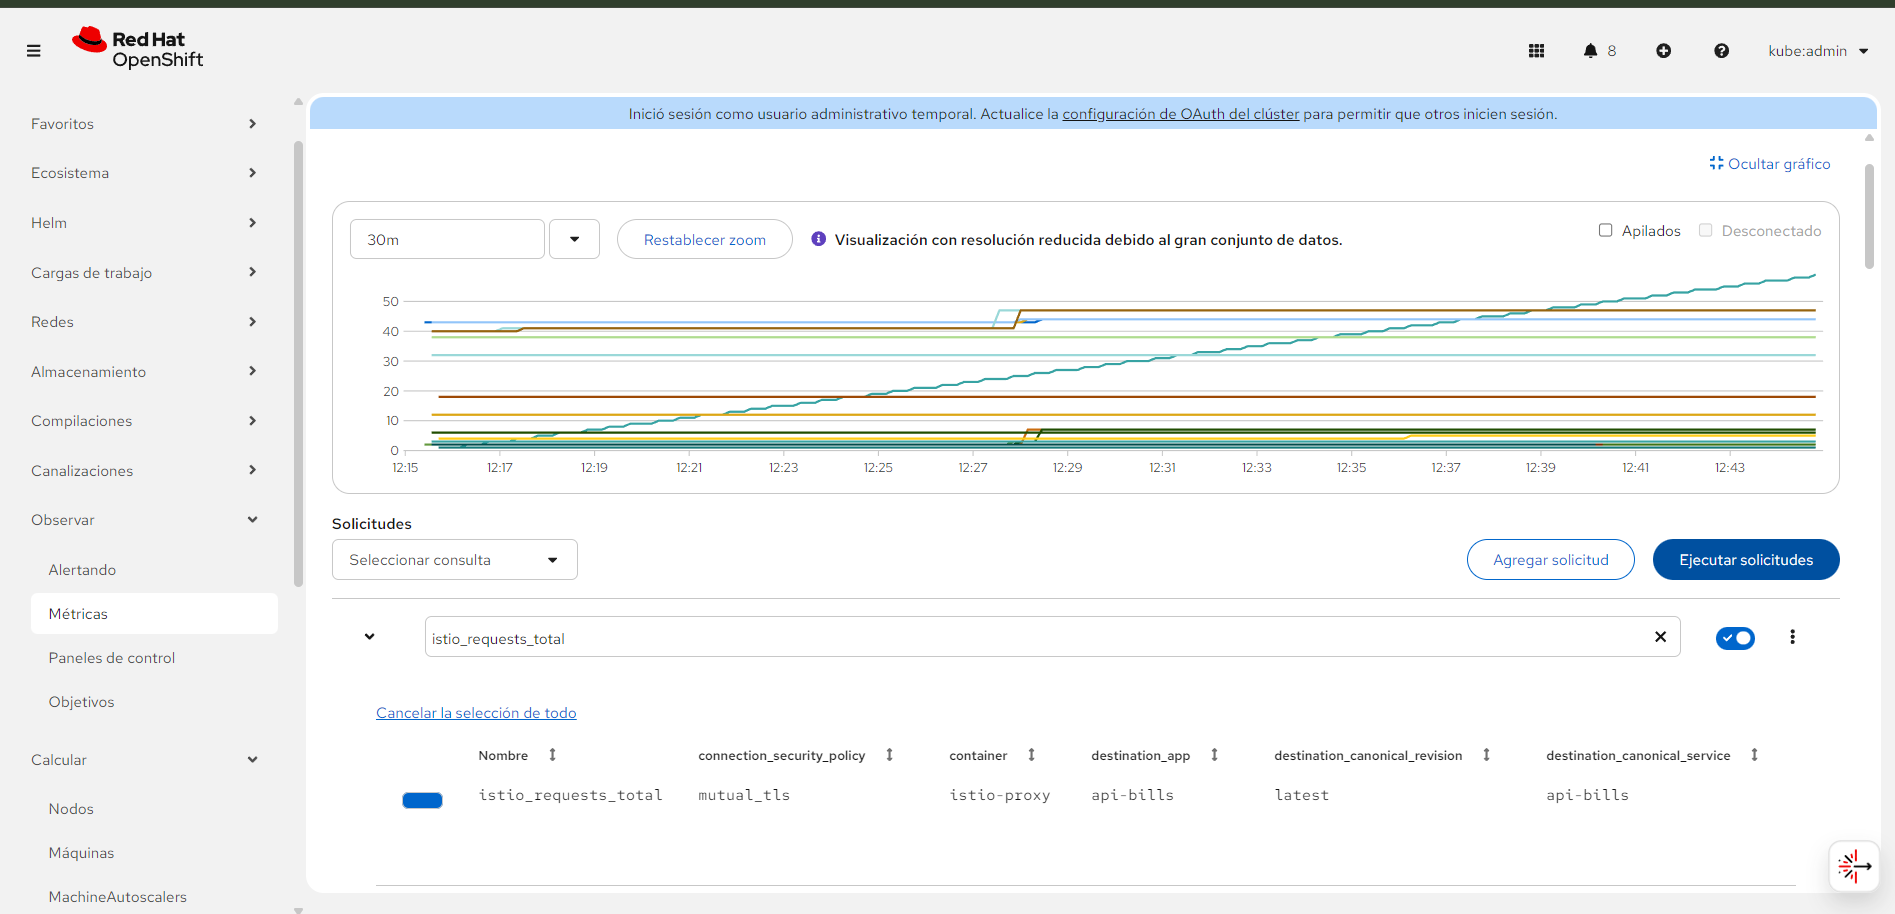 Observability overview in the OpenShift console: monitoring stack and metrics from the NFL-Wallet gateway. Click to enlarge.
 Gateway metrics (e.g. request rate, success and error rates) available in the observability UI after PodMonitor or ServiceMonitor is applied. Click to enlarge.
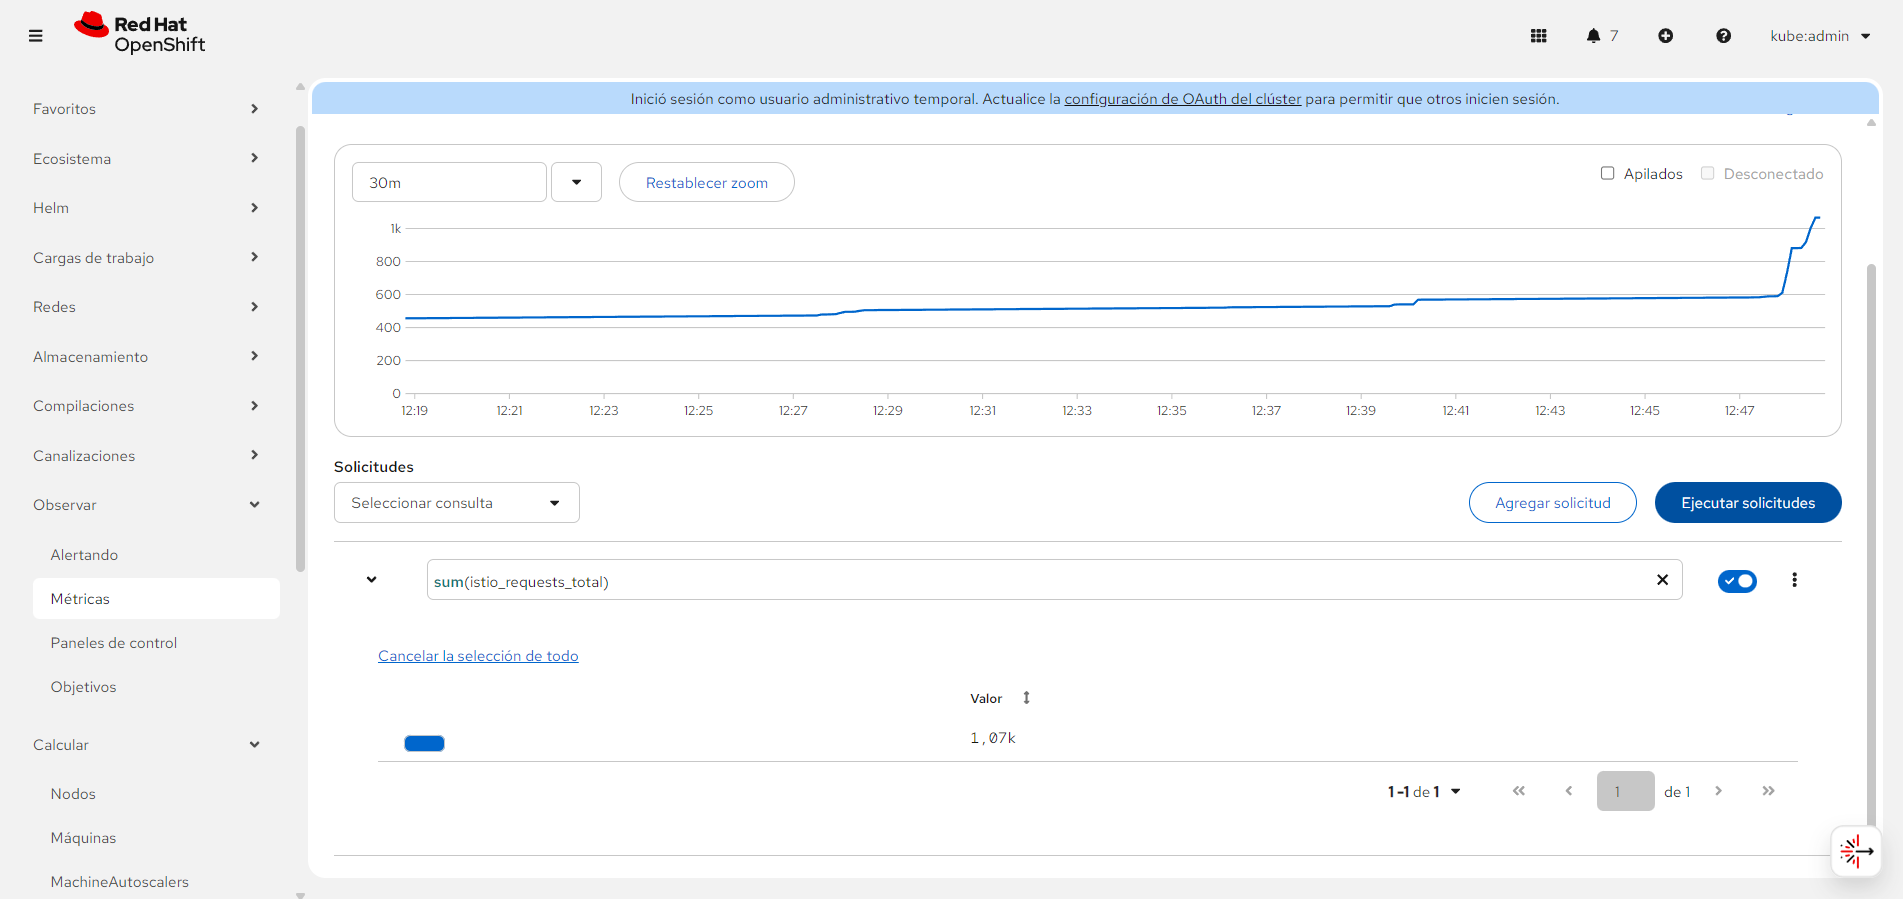
 Detailed observability view with Istio/Envoy metrics for the NFL-Wallet gateway. Click to enlarge.
Traffic analysis
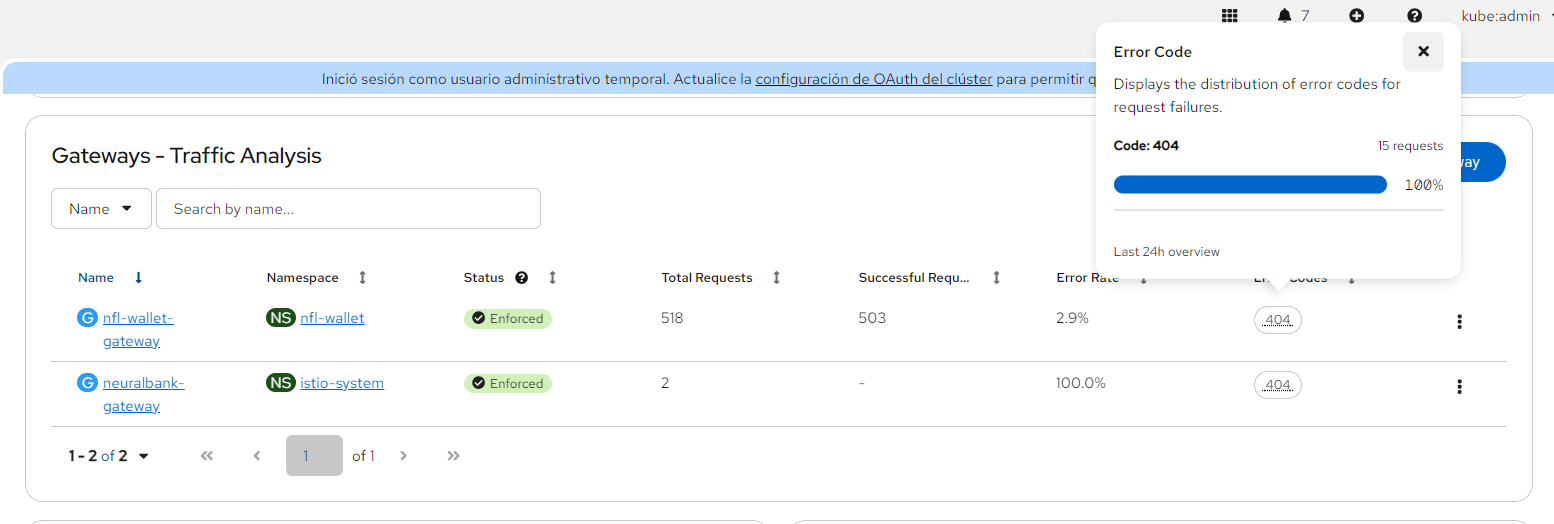
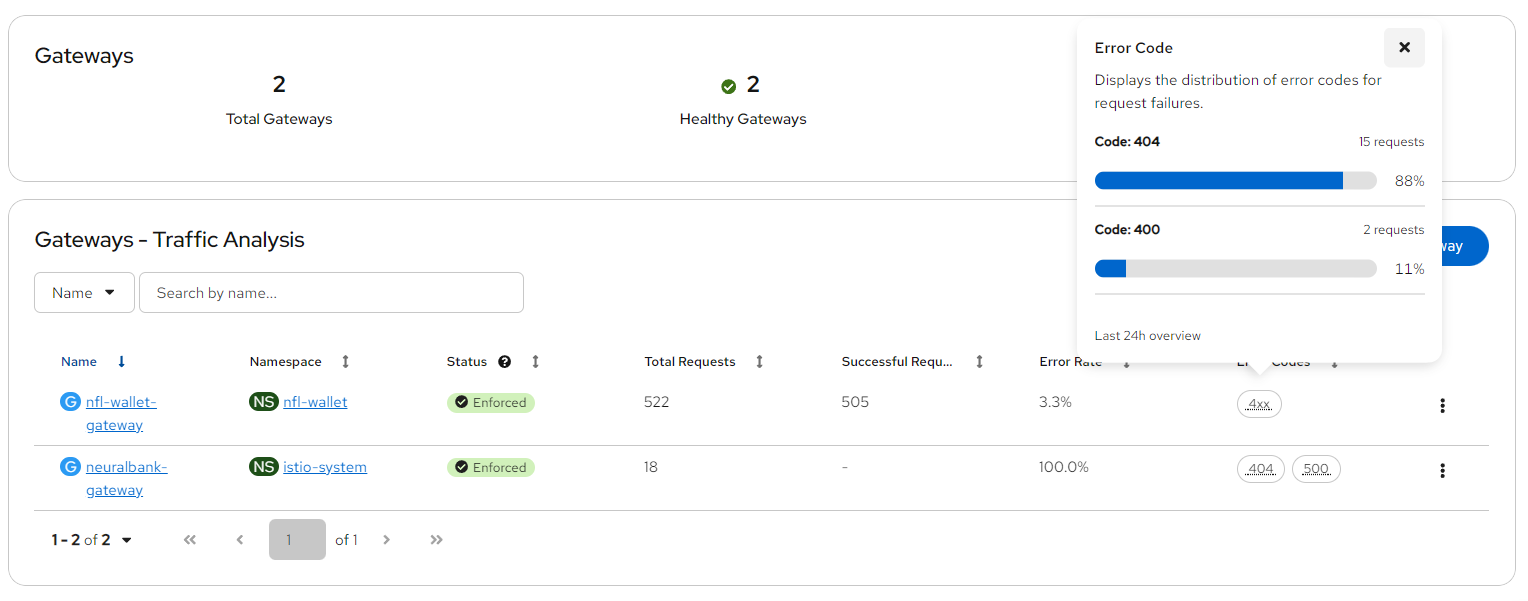 Traffic analysis view showing request flow, latency, and response codes for the gateway and backend services. Use this to inspect Total Requests, Successful Requests, and Error Rate. Click to enlarge.
Prometheus queries (reference)
Once the gateway is being scraped, you can use queries such as:
| Metric | Example query |
|---|---|
| Total Requests (rate) | sum(rate(istio_requests_total[5m])) (optionally filter by namespace or labels) |
| Successful Requests (2xx) | sum(rate(istio_requests_total{response_code=~"2.."}[5m])) |
| Error Rate | sum(rate(istio_requests_total{response_code=~"5.."}[5m])) / sum(rate(istio_requests_total[5m])) |
Adjust labels (e.g. destination_workload_namespace, destination_workload) to match your mesh. The observability UI (after UIPlugin is enabled and configured) can use the same metric names.