Observability
Observability ties together metrics, logs, traces, and mesh visualization so operators can compare east and west Industrial Edge clusters from the hub. It sits mid-flight between architecture (why telemetry crosses Skupper) and Industrial Edge (what applications emit). Screenshots below open full-screen when clicked — useful for reading dense Grafana legends.
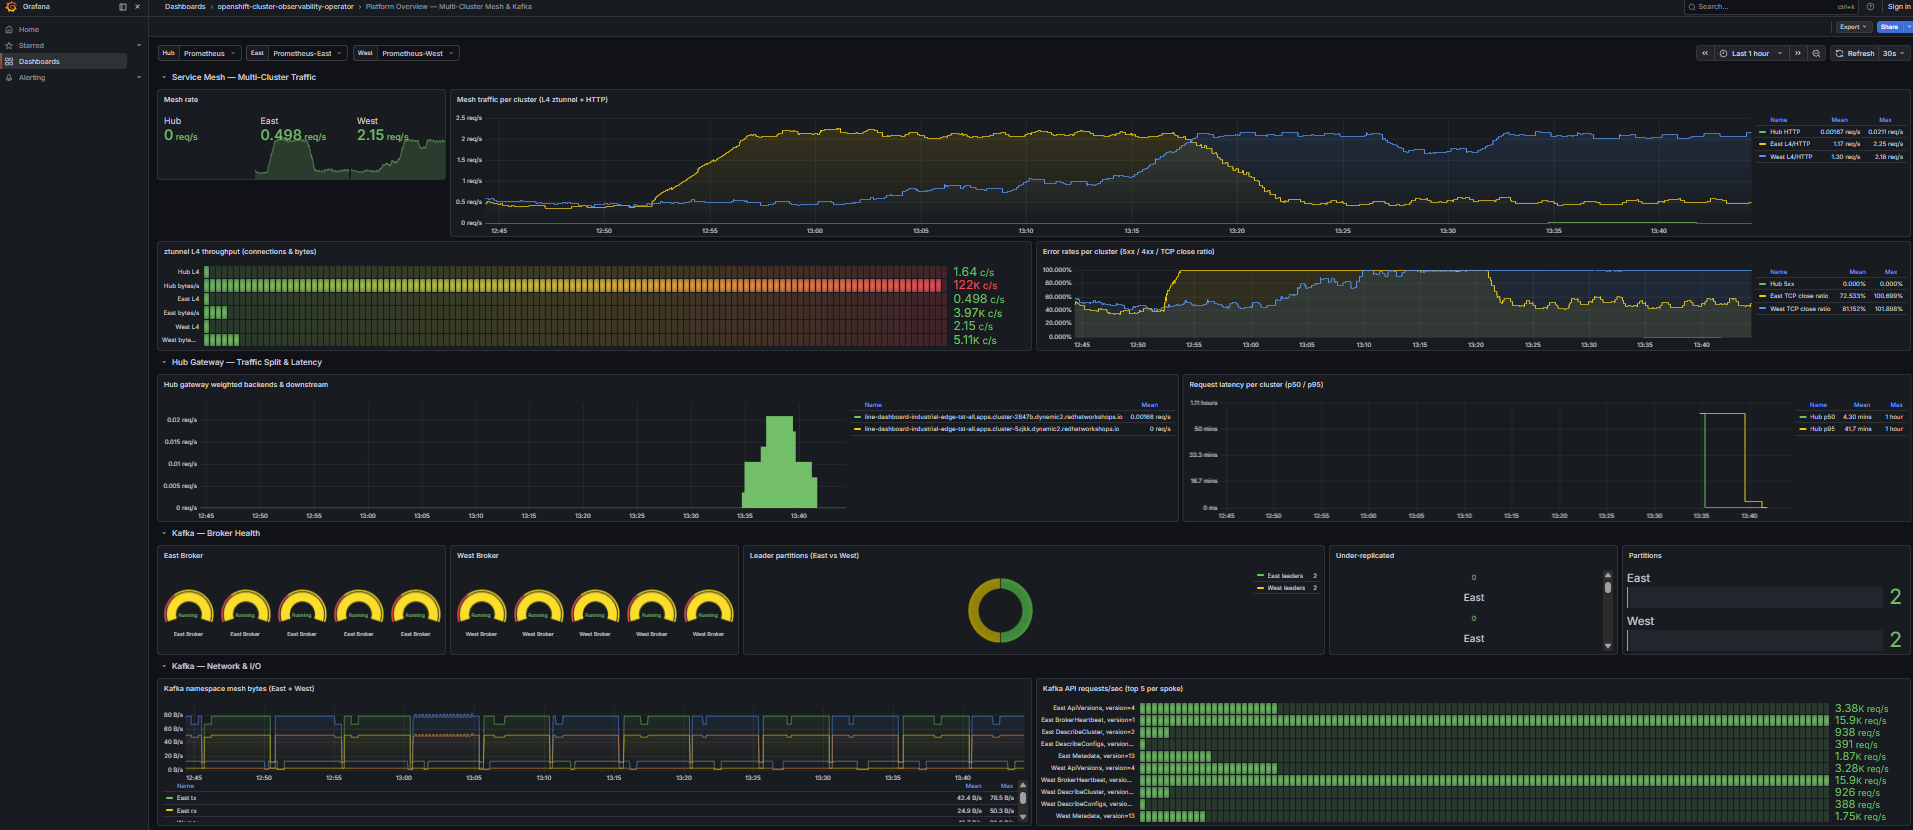
Grafana East-West Traffic & Service Mesh dashboard with multi-cluster datasources.
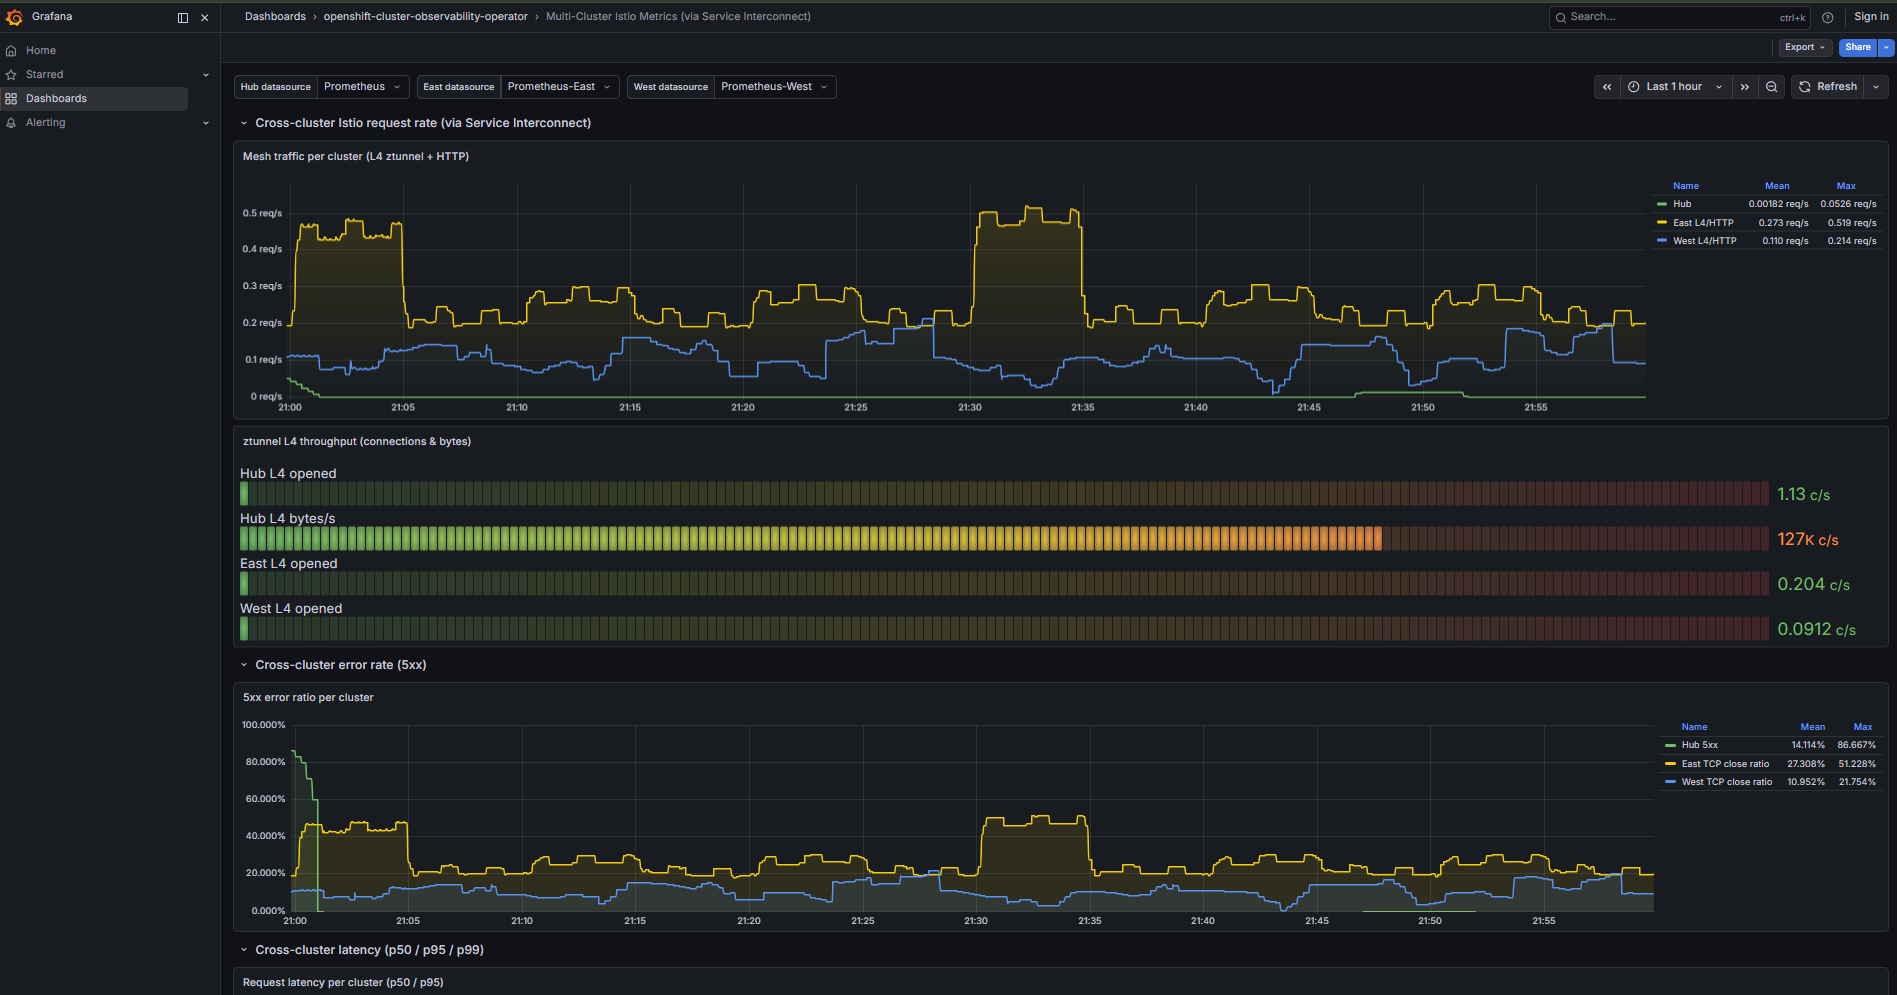
Multi-Cluster Istio Metrics — L4 ztunnel throughput and cross-cluster error rates via Service Interconnect.
Additional Grafana fleet KPI panels — Kafka and mesh signals aggregated across clusters.
Extended observability dashboard views — drill-down metrics aligned with hub Grafana dashboards.
Observability architecture
flowchart TB
  subgraph Hub["Hub Cluster"]
    direction TB
    GRAFANA_H["Grafana<br/>(multi-cluster dashboards)"]
    KIALI_H["Kiali + OSSM Console"]
    KAFKA_C["Kafka Console<br/>(4 remote clusters)"]
    OTEL_H["OpenTelemetry Collector"]
    PROM_H["Prometheus / Thanos"]
    ZT_H["ztunnel + hub-gateway"]
    DS_LOCAL["Datasource: Hub"]
    DS_EAST["Datasource: Prometheus-East"]
    DS_WEST["Datasource: Prometheus-West"]
    GRAFANA_H --> DS_LOCAL --> PROM_H
    GRAFANA_H --> DS_EAST
    GRAFANA_H --> DS_WEST
    KIALI_H --> PROM_H
    ZT_H --> PROM_H
  end

  subgraph East["East Spoke"]
    GRAFANA_E["Grafana (local)"]
    KIALI_E["Kiali + OSSM Console"]
    PROM_E["Prometheus / Thanos"]
    ZT_E["ztunnel"]
    SM_E["PodMonitor / ServiceMonitor"]
    SM_E --> PROM_E
    ZT_E --> PROM_E
    GRAFANA_E --> PROM_E
    KIALI_E --> PROM_E
  end

  subgraph West["West Spoke"]
    GRAFANA_W["Grafana (local)"]
    KIALI_W["Kiali + OSSM Console"]
    PROM_W["Prometheus / Thanos"]
    ZT_W["ztunnel"]
    SM_W["PodMonitor / ServiceMonitor"]
    SM_W --> PROM_W
    ZT_W --> PROM_W
    GRAFANA_W --> PROM_W
    KIALI_W --> PROM_W
  end

  PROM_E -->|"Skupper + auth proxy<br/>prometheus-east:9091"| DS_EAST
  PROM_W -->|"Skupper + auth proxy<br/>prometheus-west:9091"| DS_WEST
  East -->|"Kafka :9092 Skupper"| KAFKA_C
  West -->|"Kafka :9092 Skupper"| KAFKA_C
Components
| Layer | Technology | Role |
|---|---|---|
| Metrics | User Workload Monitoring / Prometheus | RED/USE signals, Kafka lag, mesh L4/L7 stats |
| Dashboards (hub) | Grafana + multi-cluster datasources | Fleet and factory KPI views (charts/all/grafana-dashboards) |
| Dashboards (spoke) | Grafana local | Per-cluster ztunnel L4, Kafka, workloads (charts/all/spoke-dashboards) |
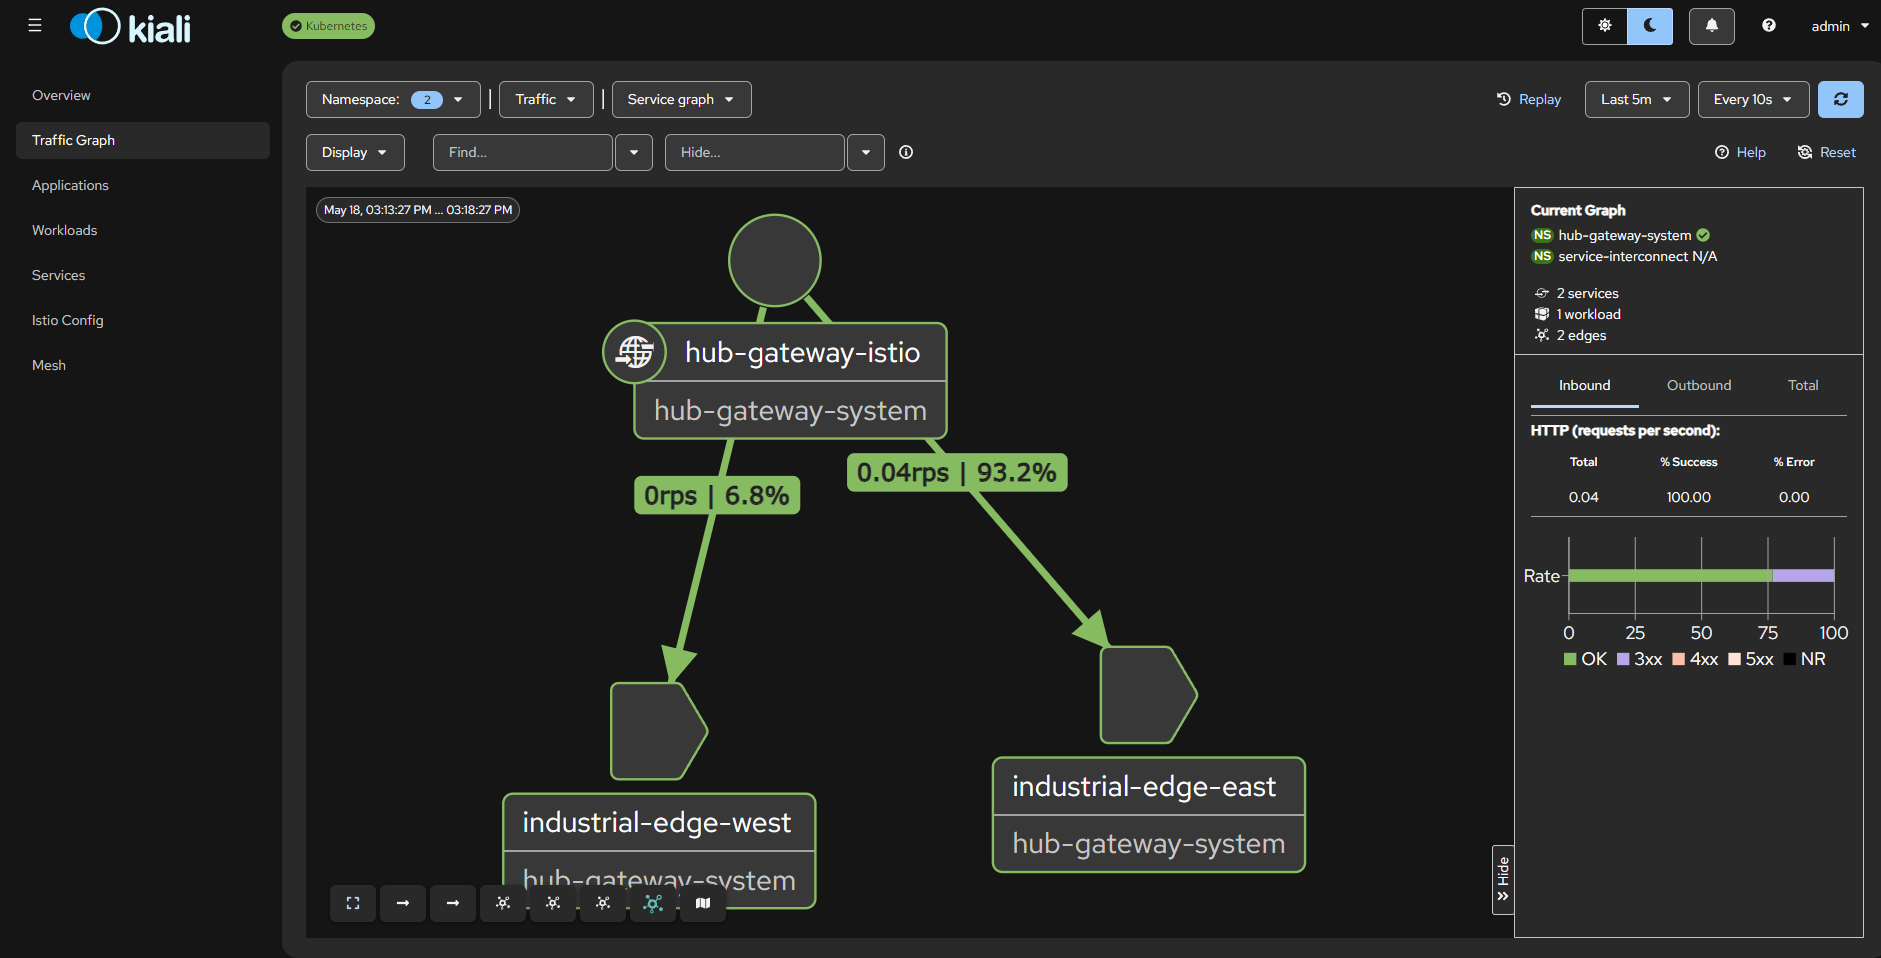
| Mesh UI | Kiali + OSSM Console plugin | Traffic graphs in OpenShift Console |
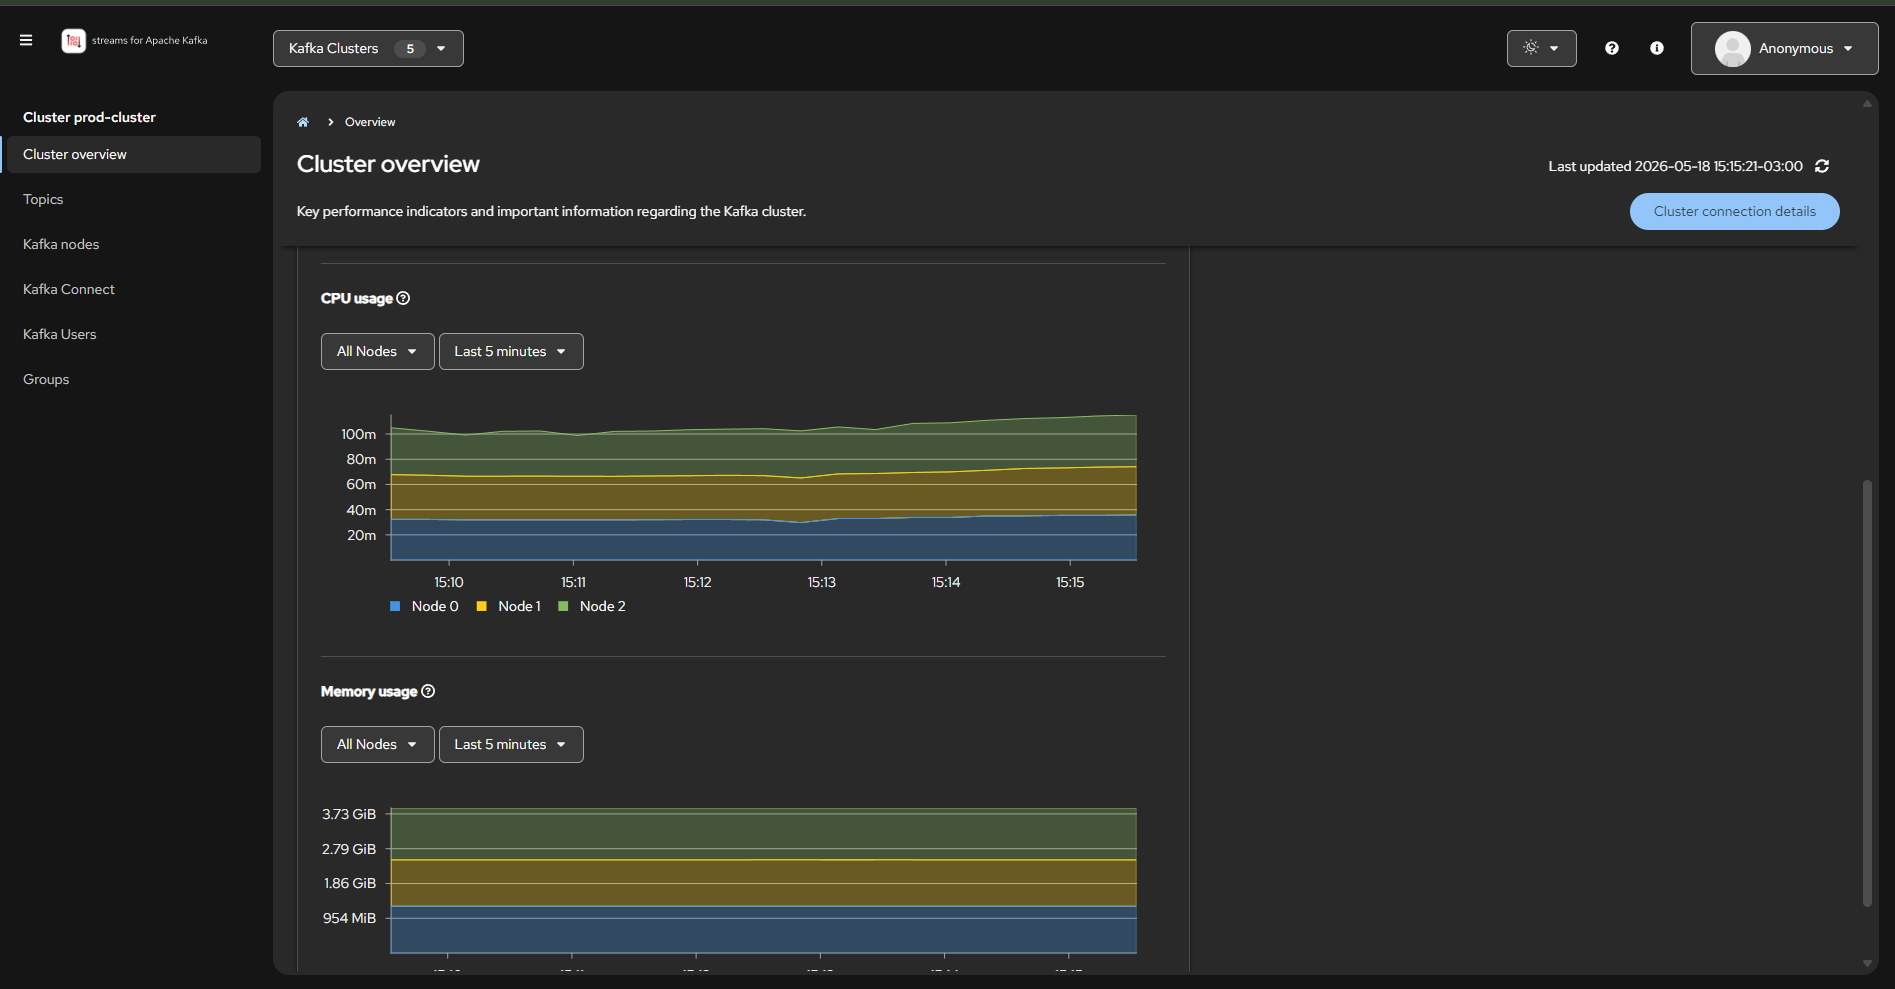
| Kafka UI | Streams for Apache Kafka Console | Hub UI for all spoke Kafka clusters (charts/all/kafka-console) |
| Cross-cluster metrics | Skupper + GrafanaDatasource | Prometheus metrics via VAN |
| Tracing | OpenTelemetry Collector | Distributed traces |
Service Mesh metrics (OSSM3 GA + ztunnel)
Use stable-3.2 for the Service Mesh operator. Tech Preview (candidates / 3.0.0-tp.2) does not deploy ztunnel.
| Metric | Producer | Notes |
|---|---|---|
istio_tcp_connections_opened_total | ztunnel | Primary spoke/hub L4 signal |
istio_tcp_sent_bytes_total / received | ztunnel | Bytes per workload namespace |
istio_requests_total | Waypoints, ingress gateways | L7; hub hub-gateway-istio always has some traffic |
kafka_server_kafkaserver_brokerstate | Strimzi JMX | 3 = Running; use in Grafana gauge panels |
kafka_network_requestmetrics_requestspersec_total | Strimzi JMX | API activity; use in bargauge panels |
kafka_server_replicamanager_leadercount / partitioncount | Strimzi JMX | piechart / bargauge on hub fleet view |
charts/all/istio-monitoring scrapes istiod, gateways/waypoints, ztunnel, and Kafka. Grant UWM RoleBindings in istio-system, ztunnel, hub-gateway-system, and Industrial Edge namespaces.
Prerequisite for L4 mesh metrics: IstioCNI CR must include profile: ambient (not namespace-only). Without it, ztunnel never becomes Ready and istio_tcp_* are absent. See Service Mesh 3 — troubleshooting.
Kiali and OSSM Console plugin
Each cluster (hub and spokes) runs Kiali with an OSSMConsole CR. The dynamic plugin adds Service Mesh to the OpenShift Console.
Fixing 401 Unauthorized on the plugin
The plugin proxies API calls to Kiali, which queries Thanos Querier (:9091). Kiali’s service account needs cluster monitoring read access.
GitOps (charts/all/kiali/templates/all.yaml):
apiVersion: rbac.authorization.k8s.io/v1
kind: ClusterRoleBinding
metadata:
  name: kiali-monitoring-rbac
roleRef:
  kind: ClusterRole
  name: cluster-monitoring-view
subjects:
- kind: ServiceAccount
  name: kiali-service-account
  namespace: openshift-cluster-observability-operator
Kiali CR external_services.prometheus:
prometheus:
  auth:
    type: bearer
    use_kiali_token: true
  thanos_proxy:
    enabled: true
  url: https://thanos-querier.openshift-monitoring.svc.cluster.local:9091
With ztunnel running, Kiali shows L4 traffic graphs; L7 graphs appear for HTTP routed through waypoints.
Grafana + Thanos (dashboards with data)
Hub Grafana uses a ServiceAccount token for local Thanos and HTTP URLs for remote spokes (Skupper auth proxy — no bearer token from hub).
Spoke Grafana uses the default Prometheus datasource (local Thanos). Do not point spoke dashboards at hub Skupper listener names unless intentionally cross-querying.
Metric panels:
| Dashboard | Visualizations | Data sources |
|---|---|---|
east-west-traffic | Gauges (broker state), donut pie (leaders East/West), bargauge (partitions, Kafka API req/s) | Hub + Prometheus-East/West |
multi-cluster-istio | Timeseries + L4 bargauge per cluster | Mixed datasources |
local-metrics | ztunnel readiness gauge, Kafka bargauge/piechart, L4 timeseries | Local Thanos |
- Hub gateway / Istio HTTP panels may show no data until clients generate traffic through
hub-gateway-istioor waypoints. - Kafka panels use
kafka_network_requestmetrics_*andkafka_server_replicamanager_*— notbrokertopicmetricswith_objectnamefilters.
Enable User Workload Monitoring on spokes (cluster-monitoring-config → enableUserWorkload: true).
Quick validation:
oc get ds -n ztunnel
oc logs -n istio-cni $(oc get pods -n istio-cni -o name | head -1) | grep AmbientEnabled
# Expect: AmbientEnabled: true
Multi-cluster metrics via Skupper
Spoke Thanos is exposed through an Nginx auth proxy on each spoke (injects bearer token), then a Skupper Connector. Hub Listeners prometheus-east / prometheus-west feed Grafana datasources.
See Service Interconnect for the full VAN diagram.
Kafka Console (hub)
The Streams for Apache Kafka Console on the hub registers five clusters: prod-cluster (hub, full metrics) + dev/factory × east/west via Skupper bootstrap services.
Metrics configuration: The metricsSources type openshift-monitoring is broken in Console operator 0.12.x (logs: Prometheus URL is not configured). Use type: standalone with:
- URL:
https://thanos-querier.openshift-monitoring.svc.cluster.local:9091 - Bearer token via
kubernetes.io/service-account-tokenSecret - TrustStore:
openshift-service-ca.crtConfigMap (PEM) ClusterRoleBindingforcluster-monitoring-view
Each kafkaCluster entry must include namespace — without it, logs show namespace is required for metrics retrieval.
Only the hub prod-cluster (namespace industrial-edge-data-lake) displays full metrics. Spoke clusters via Skupper show topics and nodes but no metrics (their Prometheus data is not federated to hub Thanos).
Common error: Timed out waiting for a node assignment / listNodes — the console reaches bootstrap over Skupper but broker advertised DNS from spokes does not resolve on the hub.
Fix:
- Spokes: Strimzi
advertisedHostper broker withclusterNamesuffix (dev-cluster-broker-0-east, etc.) - Hub: headless Services +
EndpointSliceincharts/all/kafka-console/templates/broker-dns.yaml(Helmlookupof Skupper ClusterIPs per broker)
Argo CD excludes Endpoints from managed resources — use EndpointSlice so broker DNS syncs via GitOps.
Re-sync the kafka-console Argo CD application after Skupper listeners are healthy. Confirm listNodes returns 200 in the Console UI.
Grafana dashboard inventory
| Dashboard | Scope | Datasources |
|---|---|---|
platform-overview | Hub | Hub, Prometheus-East, Prometheus-West — mesh, hub-gateway, Kafka fleet KPIs |
local-metrics | Each spoke | Local Prometheus (UWM/Thanos) — ztunnel + Kafka + workloads |
Legacy doc names east-west-traffic / multi-cluster-istio are consolidated into platform-overview (charts/all/grafana-dashboards/templates/platform-overview.yaml).
Fleet metrics checklist
- Skupper VAN complete —
sitesInNetwork: 3 - Hub listeners
prometheus-east,prometheus-westReady - Spoke Connectors +
prometheus-auth-proxyRunning (spoke-interconnect) - GrafanaDatasource CRs present on hub
- Generate traffic (Industrial Edge / hub-gateway) for mesh panels
References
Charts: charts/all/observability, charts/all/grafana-dashboards, charts/all/spoke-dashboards, charts/all/kiali, charts/all/kafka-console, charts/all/opentelemetry, charts/all/istio-monitoring, charts/all/service-interconnect, charts/all/spoke-interconnect.
Next → Industrial Edge for the factory data pipeline pattern, then deep dive into Red Hat Products for per-operator specifics (Service Mesh, Service Interconnect, AMQ Streams).